rvn_flow_residuals creates a residuals time series for flow values. Useful in diagnotic analysis of model outputs.
rvn_flow_residuals(
  sim = NULL,
  obs = NULL,
  ma_smooth = 3,
  add_line = FALSE,
  winter_shading = FALSE,
  wsdates = c(12, 1, 3, 31)
)
Arguments
- sim
time series object of simulated flows
- obs
time series object of observed flows
- ma_smooth
optional length of rolling average to smooth residuals with (default 3)
- add_line
optionally adds a horizontal line to the plot for reference (default
FALSE)- winter_shading
optionally adds a light blue shading to winter months (default
FALSE)- wsdates
integer vector of winter shading period dates (see details)
Value
- resids
residual time series
Details
Creates a residuals time series plot for flow values, with the option to smooth out the values using the rollmean function in zoo. The winter months are optionally shaded in the time series; winter period is defined as December 1st to March 31st.
The residuals are calculated as sim - obs.
The sim and obs should be of time series (xts) format. The flow series are assumed to be daily flows with units of m3/s.
Note that a plot title is purposely omitted in order to allow the automatic generation of plot titles.
The winter_shading argument will add a transparent grey shading for the specified period by wsdates in each year that is plotted.
wsdates is formatted as c(winter start month, winter start day, winter end month, winter end day).
See also
rvn_flow_scatterplot to create a scatterplot of flow
values
Examples
# load sample hydrograph data, two years worth of sim/obs
ff <- system.file("extdata/run1_Hydrographs.csv", package="RavenR")
run1 <- rvn_hyd_read(ff)
sim <- run1$hyd$Sub36
obs <- run1$hyd$Sub36_obs
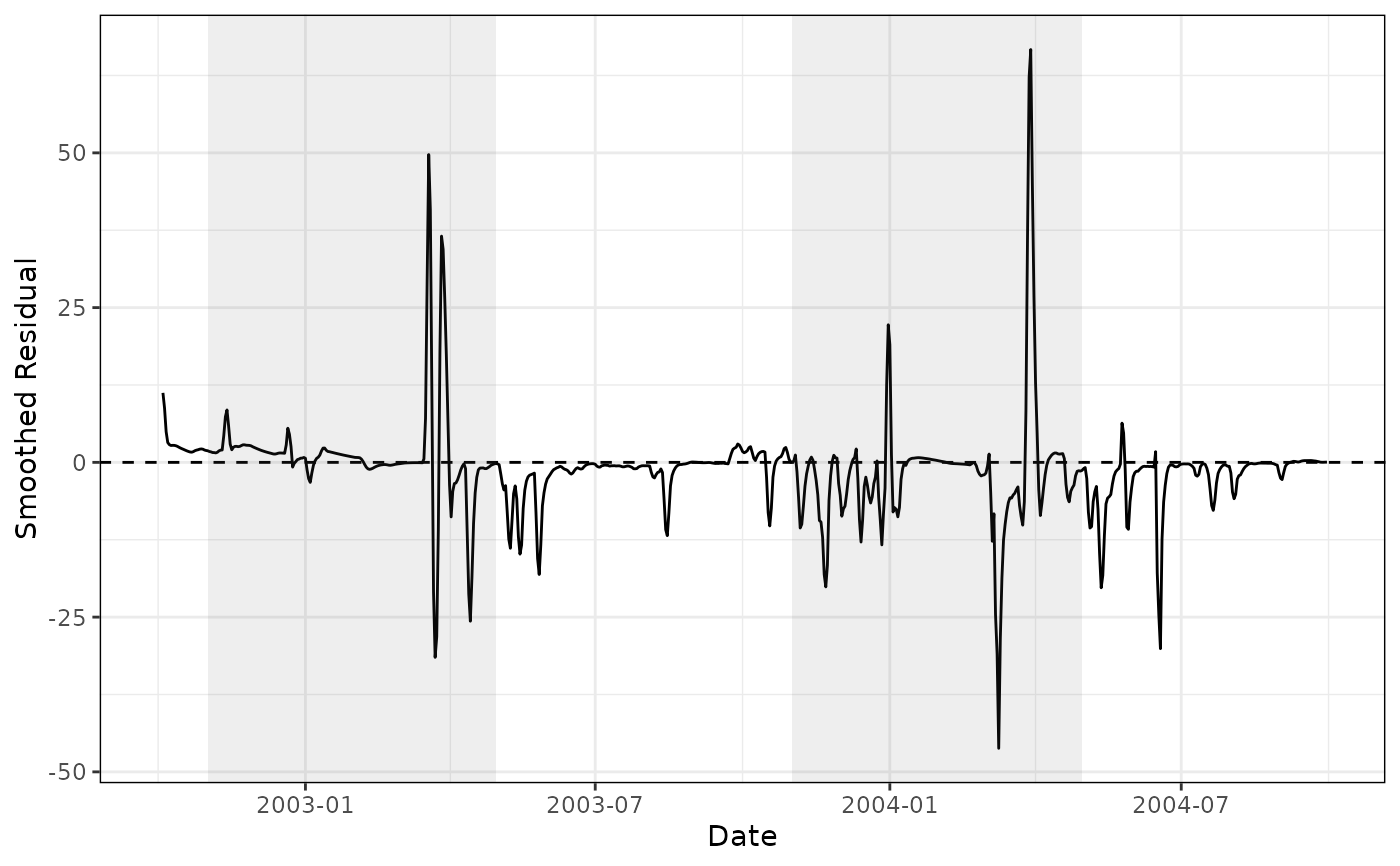
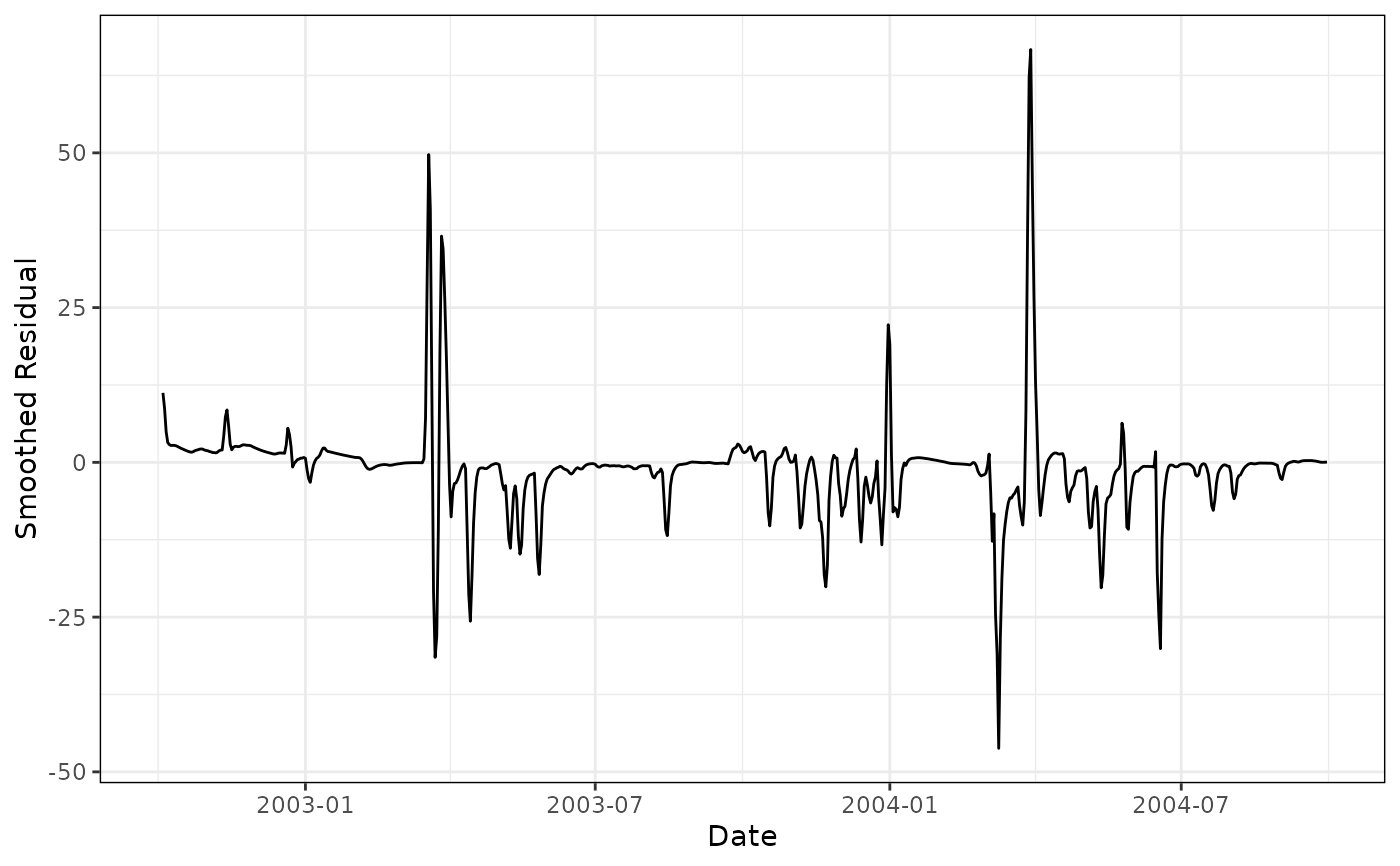
# default with moving average smoothing shading of winter months
rvn_flow_residuals(sim,obs)$plot
#> Warning: Removed 3 rows containing missing values or values outside the scale range
#> (`geom_line()`).
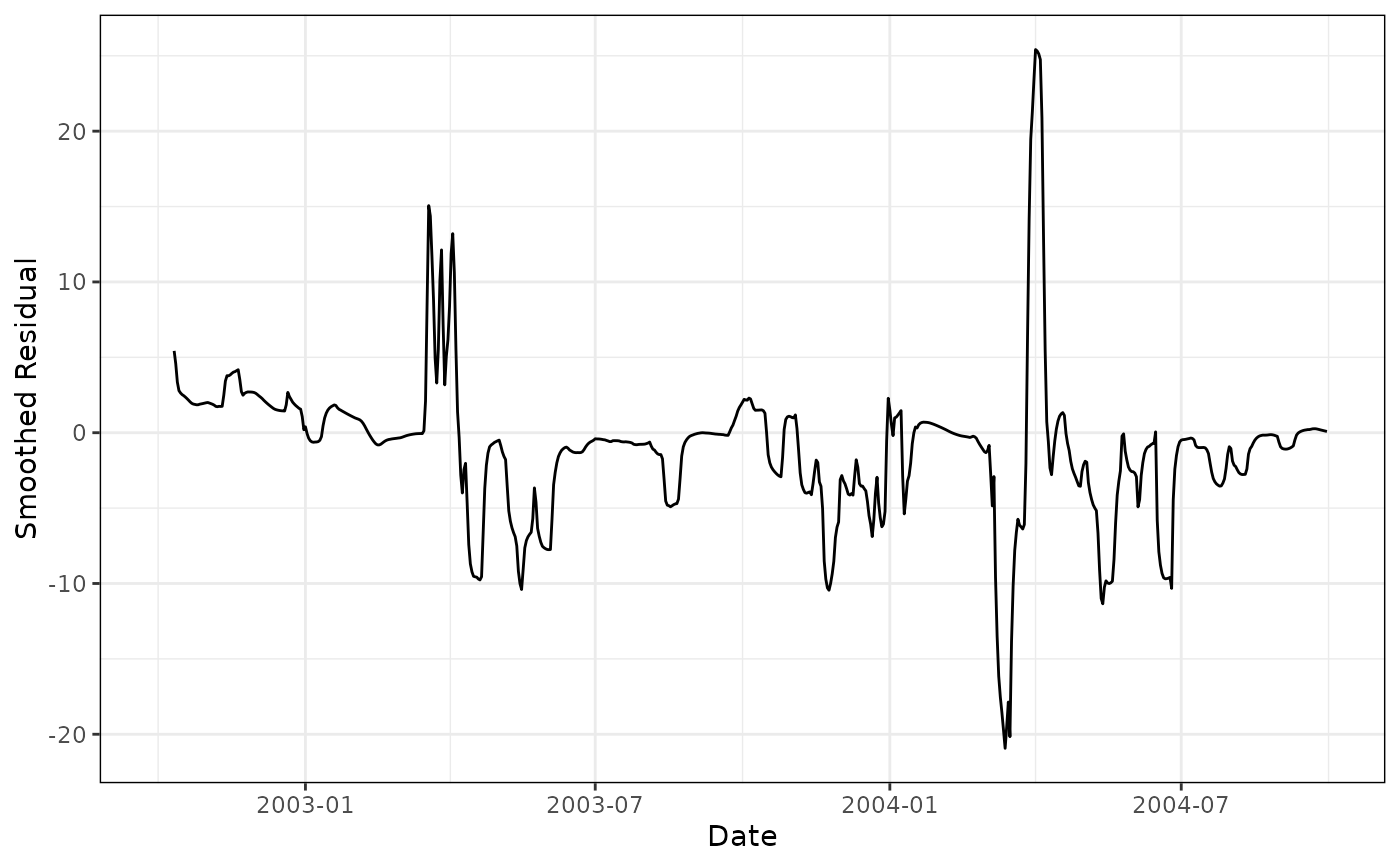
 # plot with more smoothing than the default 3
rvn_flow_residuals(sim, obs, ma_smooth=10)$plot
#> Warning: Removed 10 rows containing missing values or values outside the scale range
#> (`geom_line()`).
# plot with more smoothing than the default 3
rvn_flow_residuals(sim, obs, ma_smooth=10)$plot
#> Warning: Removed 10 rows containing missing values or values outside the scale range
#> (`geom_line()`).
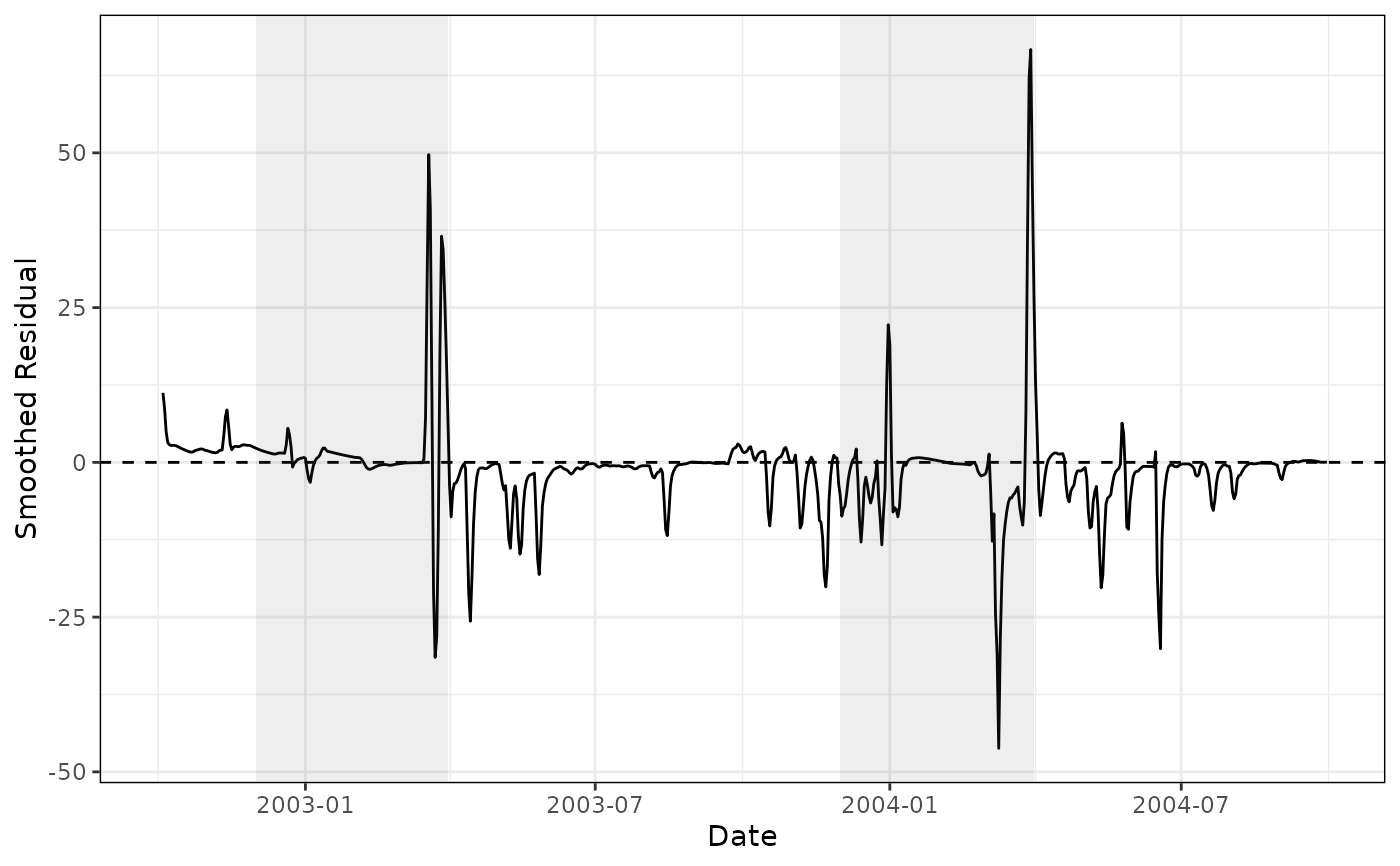
 # with zero line and winter shading
rvn_flow_residuals(sim,obs, add_line=TRUE, winter_shading = TRUE)$plot
#> Warning: Removed 3 rows containing missing values or values outside the scale range
#> (`geom_line()`).
# with zero line and winter shading
rvn_flow_residuals(sim,obs, add_line=TRUE, winter_shading = TRUE)$plot
#> Warning: Removed 3 rows containing missing values or values outside the scale range
#> (`geom_line()`).
 # change winter shading to Nov 1 - April 30
rvn_flow_residuals(sim,obs, add_line=TRUE,
winter_shading = TRUE, wsdates=c(11,1,4,30))$plot
#> Warning: Removed 3 rows containing missing values or values outside the scale range
#> (`geom_line()`).
# change winter shading to Nov 1 - April 30
rvn_flow_residuals(sim,obs, add_line=TRUE,
winter_shading = TRUE, wsdates=c(11,1,4,30))$plot
#> Warning: Removed 3 rows containing missing values or values outside the scale range
#> (`geom_line()`).