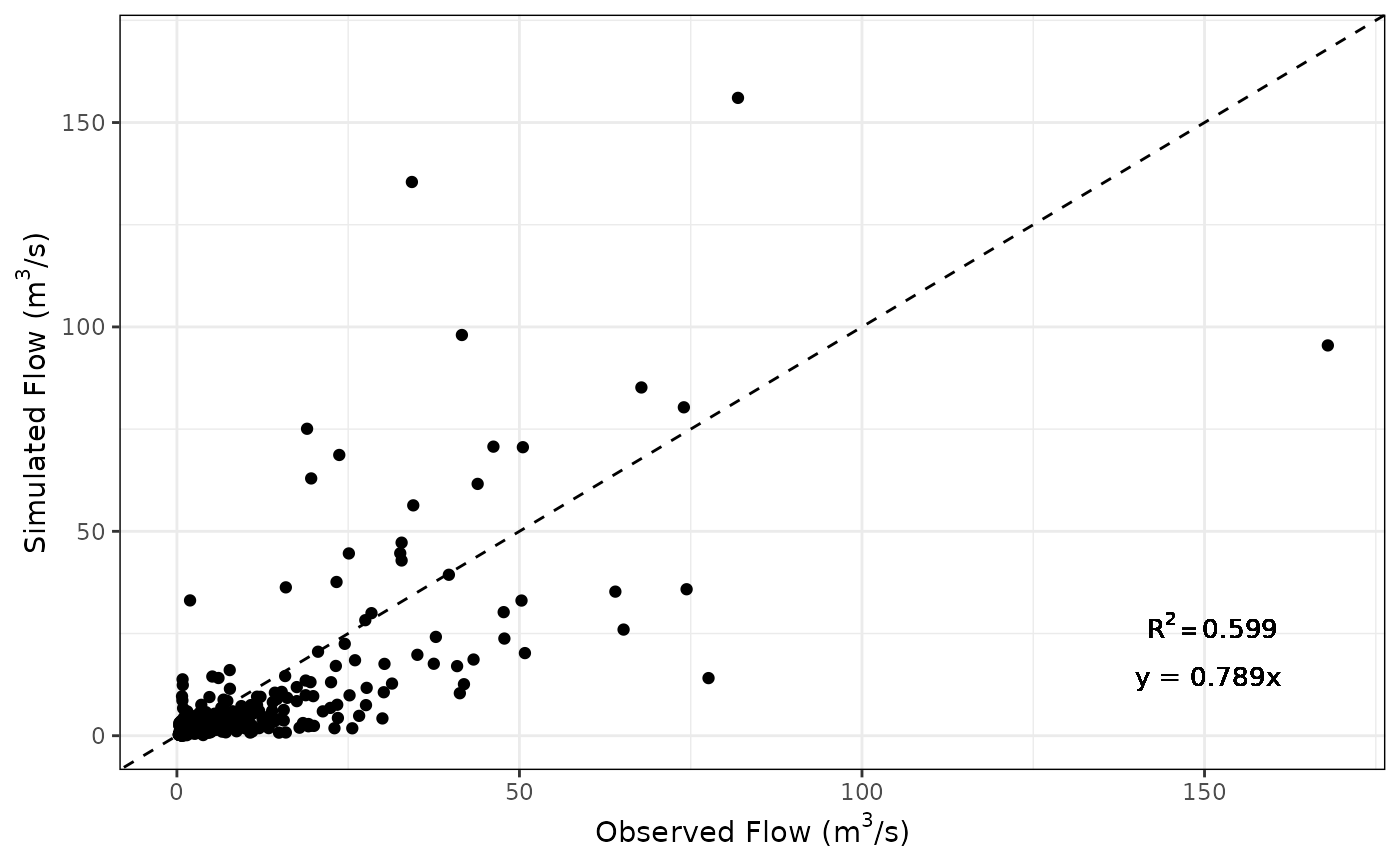
rvn_flow_scatterplot creates a scatterplot of the simulated and observed flows. Useful in diagnotic analysis of model outputs.
rvn_flow_scatterplot(
  sim,
  obs,
  add_line = TRUE,
  add_r2 = FALSE,
  add_eqn = FALSE
)
Arguments
- sim
time series object of simulated flows
- obs
time series object of observed flows
- add_line
optionally adds a 1:1 line to the plot for reference (default
TRUE)- add_r2
optionally computes the R2 and adds to plot (default
FALSE)- add_eqn
optionally adds the equation for a linear regression line (default
FALSE)
Value
- TRUE
return
TRUEif the function is executed properly
Details
Creates a scatterplot of flows.
The sim and obs should be of time series (xts) format. The flow series are assumed to be daily flows with units of m3/s.
The R2 diagnostic is calculated for a fit with no intercept (in a perfect fit the points are identical, and intercept is automatically zero). The R2 is calculated with the NA values removed
Note that a plot title is purposely omitted in order to allow the automatic generation of plot titles.
See also
rvn_forcings_read for reading in the ForcingFunctions
file
Examples
# load sample hydrograph data, two years worth of sim/obs
data(rvn_hydrograph_data)
sim <- rvn_hydrograph_data$hyd$Sub36
obs <- rvn_hydrograph_data$hyd$Sub36_ob

# plot the flow scatterplot, produce an R2 metric
rvn_flow_scatterplot(sim,obs,add_r2=TRUE)
#> Warning: Removed 1 row containing missing values or values outside the scale range
#> (`geom_point()`).


# plot again with a regression equation
rvn_flow_scatterplot(sim,obs,add_r2=TRUE,add_eqn=TRUE)
#> Warning: Removed 1 row containing missing values or values outside the scale range
#> (`geom_point()`).
# plot again with a regression equation
rvn_flow_scatterplot(sim,obs,add_r2=TRUE,add_eqn=TRUE)
#> Warning: Removed 1 row containing missing values or values outside the scale range
#> (`geom_point()`).