rvn_budyko_plot creates a Budyko plot, adding supplied data points if provided.
rvn_budyko_plot(
  x = NULL,
  x_indices = NULL,
  limiting_labels = FALSE,
  budyko_curve = FALSE,
  mm = 9,
  dd = 30
)
Arguments
- x
extensible time series object of PET, AET, and PRECIP (optional)
- x_indices
extensible time series object of annual ARIDITY and EVAPORATION indices (optional)
- limiting_labels
boolean whether to vertical line at x=1 and labels for 'Energy Limited' and 'Water Limited' to plot
- budyko_curve
boolean whether to add curve to plot
- mm
month of water year ending (default 9)
- dd
day of water year ending (default 30)
Value
- p1
returns Budyko plot as ggplot object
Details
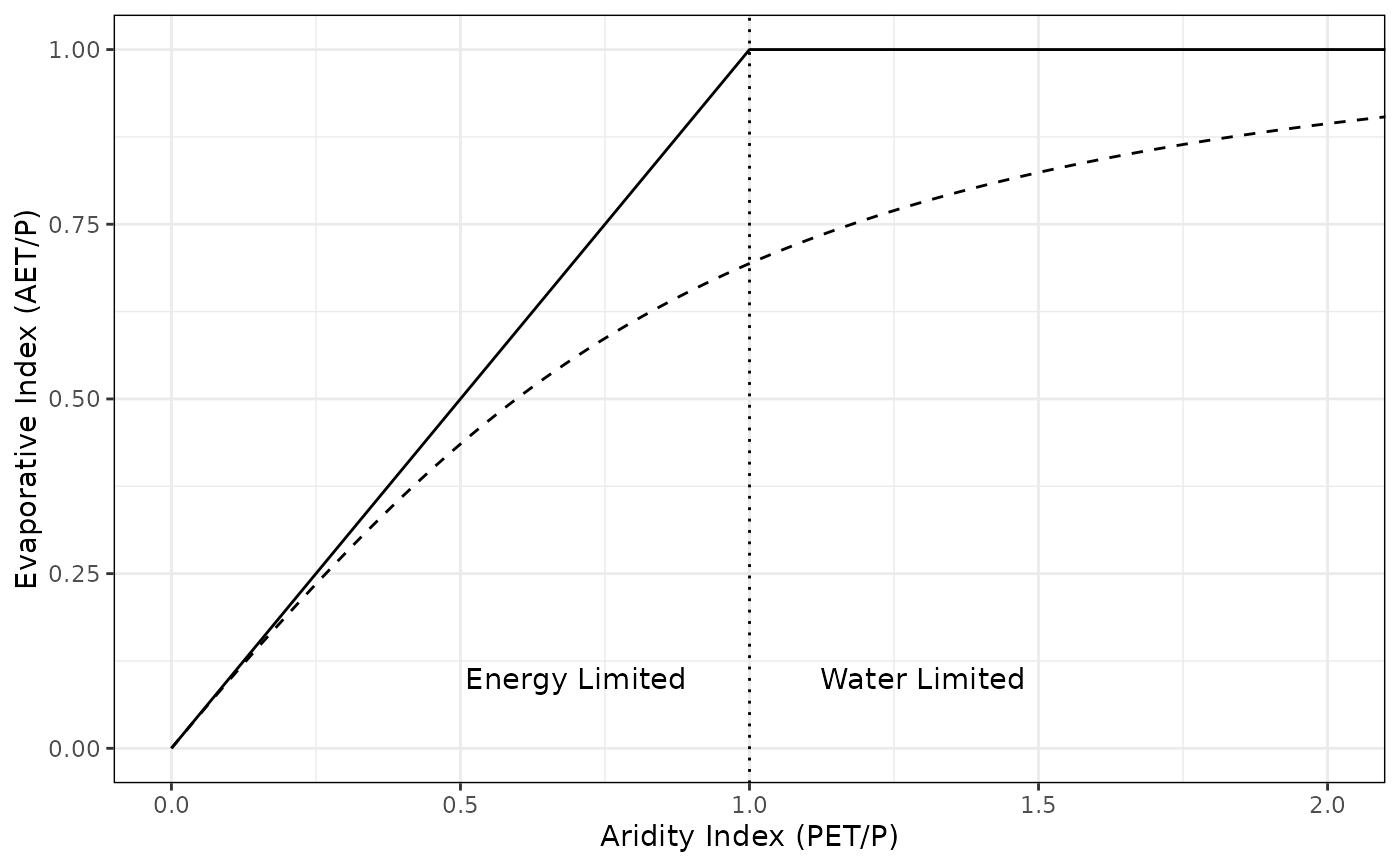
Creates a blank Budyko curve plot if no data is provided. Labels may optionally
be added to the plot with limiting_labels=TRUE to indicate where in the
curve the energy-limited and water-limited limits are. The original Budyko curve
may also be added with budyko_curve=TRUE.
Data may be provided and plotted in the graph as well. If data is provided, it can be provided as: - x: an xts object with PRECIP, AET, and PET columns - x_indices: an xts object with indices calculated for each year, columns named ARIDITY and EVAPORATIVE
References
Budyko, M.I. (1974), Climate and Life, Academic Press, New York.
See also
rvn_watershedmeb_read for reading in the WatershedMassEnergyBalance.csv file, and
rvn_apply_wyearly to apply functions over the water year.
Examples
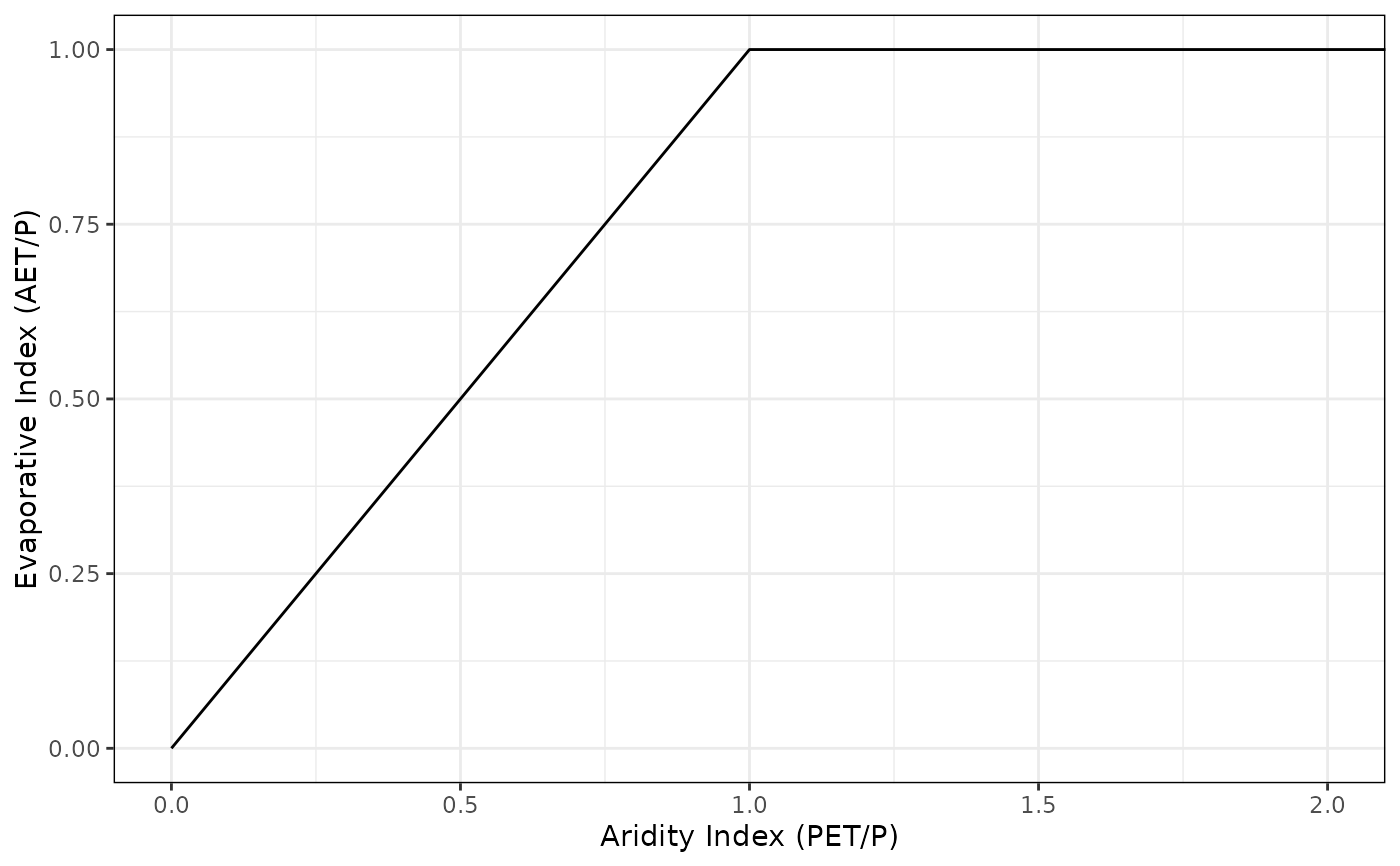
# return blank Budyko plot
rvn_budyko_plot()
 # return blank plot with labels and curve added
rvn_budyko_plot(limiting_labels=TRUE, budyko_curve=TRUE)
# return blank plot with labels and curve added
rvn_budyko_plot(limiting_labels=TRUE, budyko_curve=TRUE)
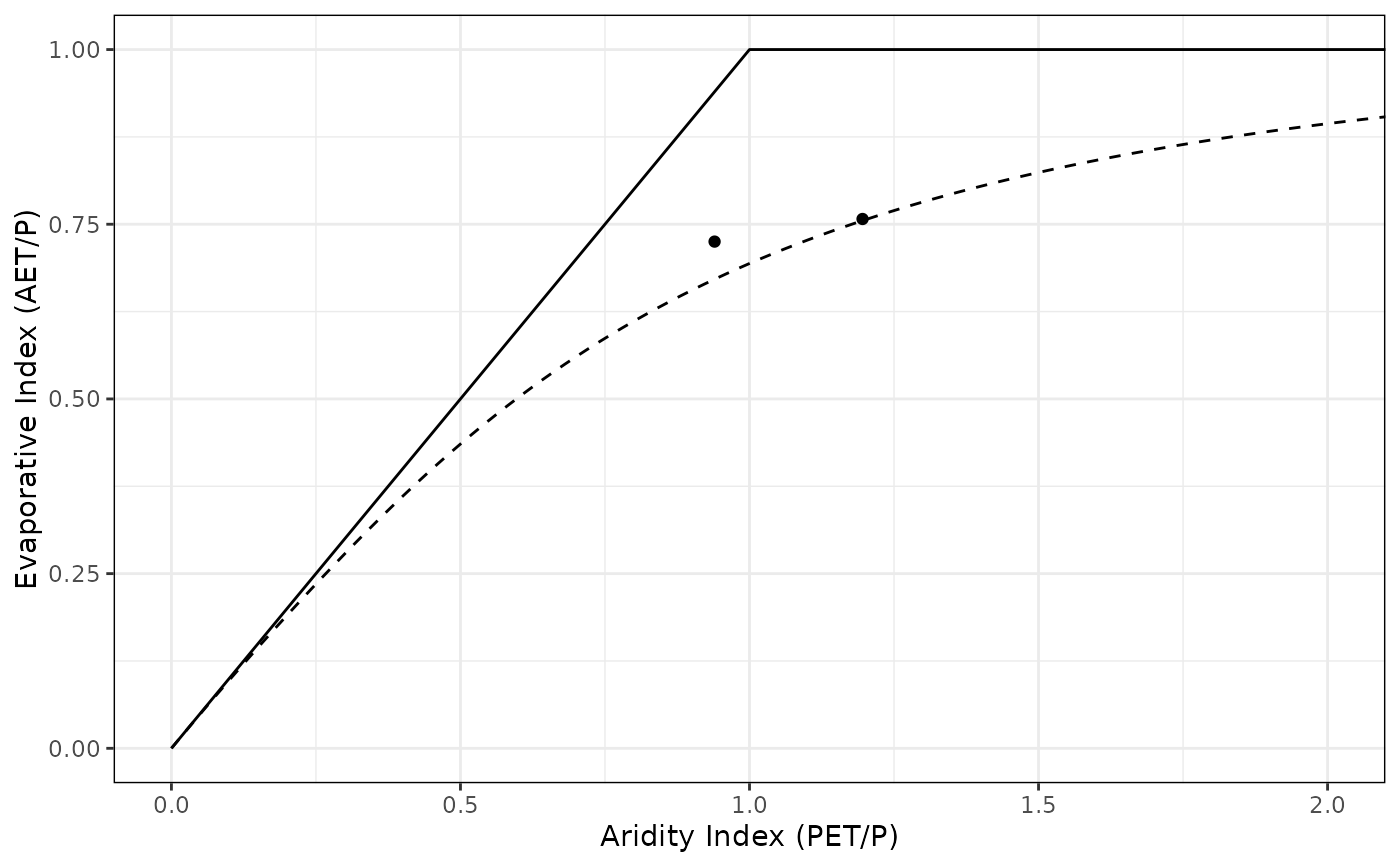
 # plot sample data on Budyko plot (two years of data)
wstor <- system.file("extdata","run1_WatershedStorage.csv", package="RavenR") %>%
rvn_watershed_read()
ff <- system.file("extdata","run1_ForcingFunctions.csv", package="RavenR") %>%
rvn_forcings_read()
library(xts)
#> Loading required package: zoo
#>
#> Attaching package: ‘zoo’
#> The following objects are masked from ‘package:base’:
#>
#> as.Date, as.Date.numeric
precip <- ff$forcings$rain+ff$forcings$snow
pet <- ff$forcings$PET
aet <- diff.xts(x=wstor$watershed_storage$Cum..Losses.to.Atmosphere..mm.,
k=1, na.pad=TRUE)
aet[1] <- 0
x <- merge.xts(precip,pet,aet)
names(x) <- c("precip","pet","aet")
rvn_budyko_plot(x=x, budyko_curve=TRUE)
# plot sample data on Budyko plot (two years of data)
wstor <- system.file("extdata","run1_WatershedStorage.csv", package="RavenR") %>%
rvn_watershed_read()
ff <- system.file("extdata","run1_ForcingFunctions.csv", package="RavenR") %>%
rvn_forcings_read()
library(xts)
#> Loading required package: zoo
#>
#> Attaching package: ‘zoo’
#> The following objects are masked from ‘package:base’:
#>
#> as.Date, as.Date.numeric
precip <- ff$forcings$rain+ff$forcings$snow
pet <- ff$forcings$PET
aet <- diff.xts(x=wstor$watershed_storage$Cum..Losses.to.Atmosphere..mm.,
k=1, na.pad=TRUE)
aet[1] <- 0
x <- merge.xts(precip,pet,aet)
names(x) <- c("precip","pet","aet")
rvn_budyko_plot(x=x, budyko_curve=TRUE)