Basic Raven subbasin network plot
Source:R/rvn_rvh_subbasin_network_plot.R
rvn_rvh_subbasin_network_plot.RdGenerates a plot of the subbasin network from rvh file information.
rvn_rvh_subbasin_network_plot(SBtable, labeled = FALSE)Arguments
- SBtable
a valid table of Raven subbasins, obtained from
rvn_rvh_read- labeled
TRUE if the nodes are labeled with the SubBasin ID, SBID
Value
- p1
ggplot object of subbasin network plot
Details
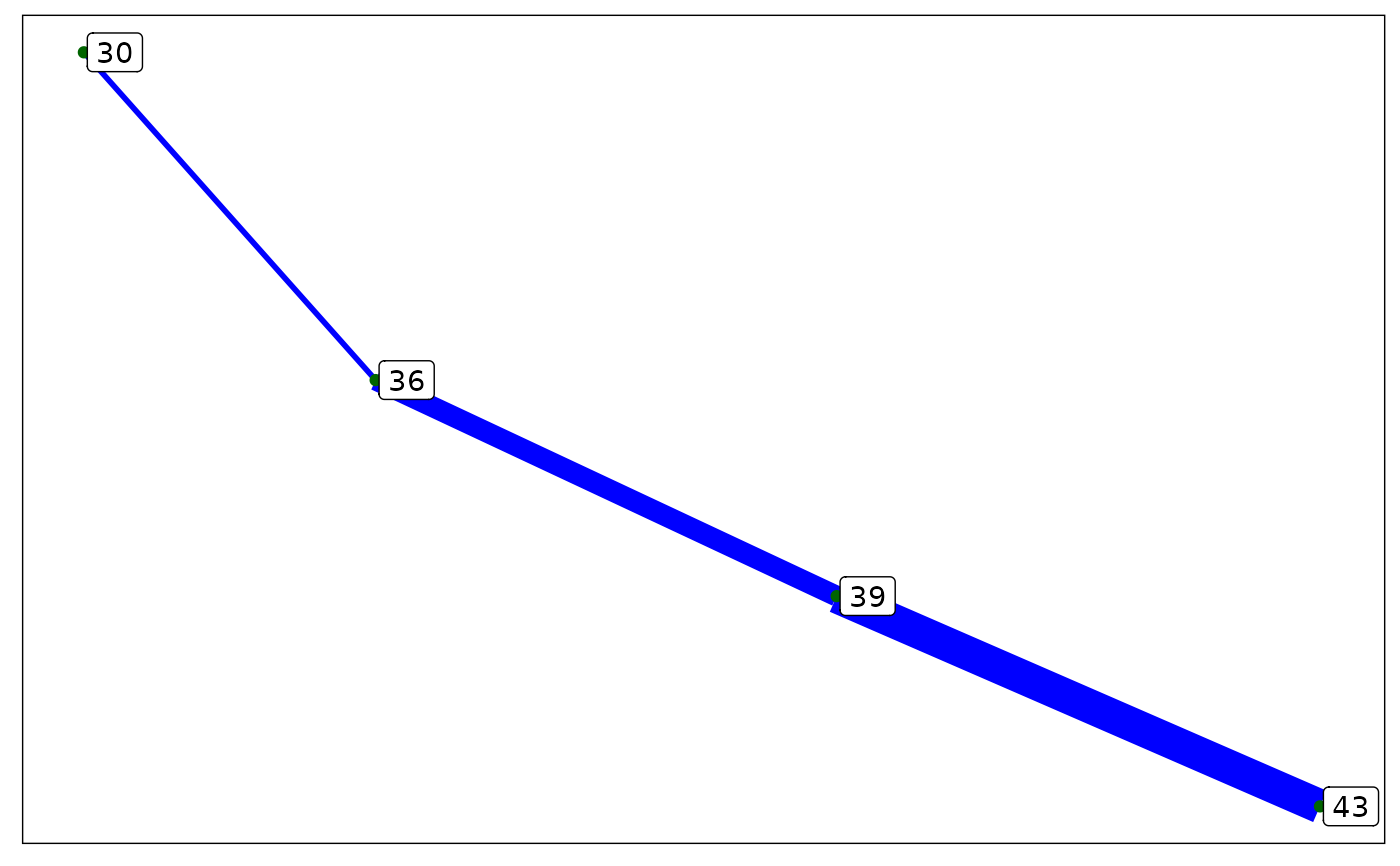
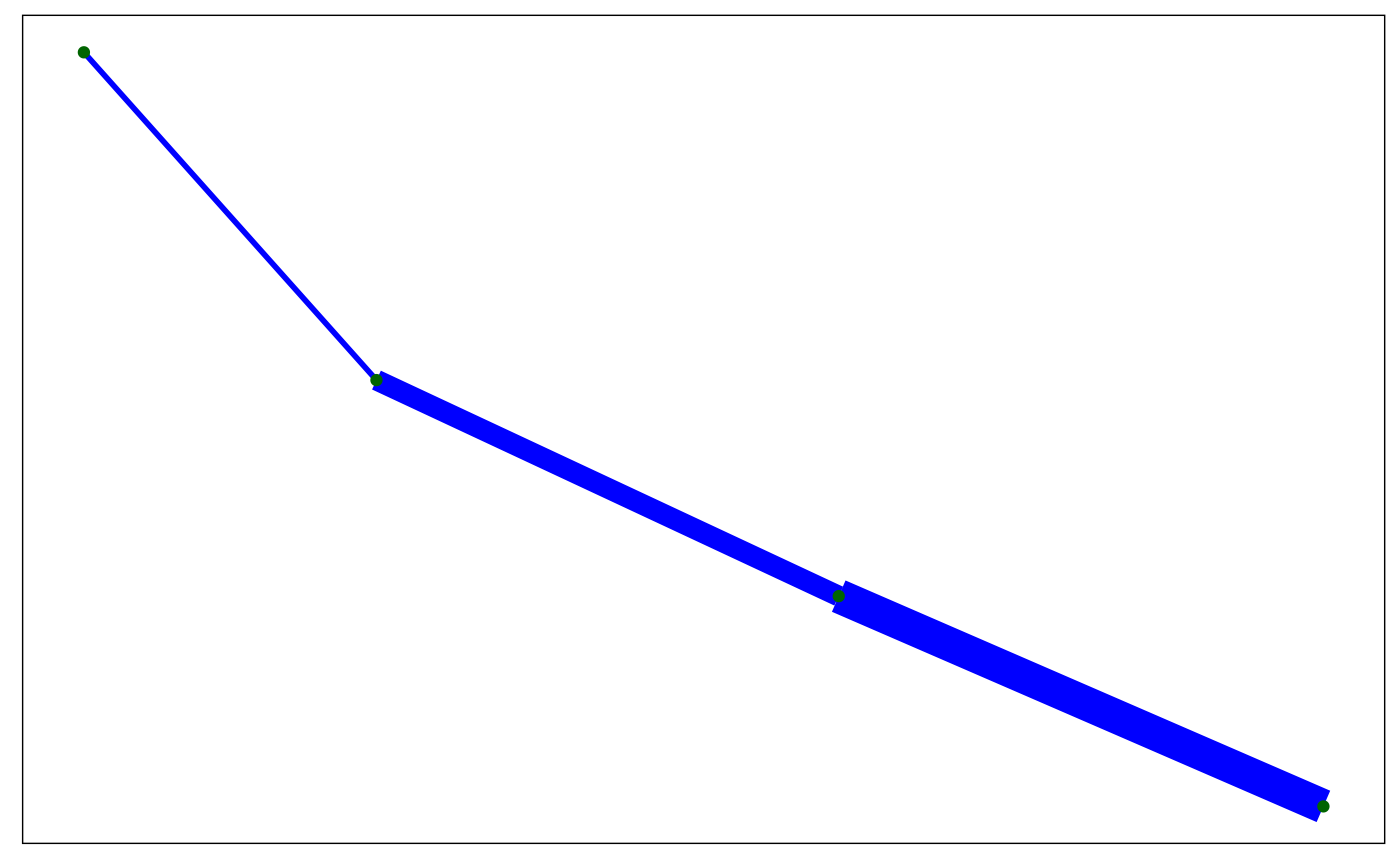
Takes the information gathered from an .rvh file via the function rvn_rvh_read and
generates a plot object of the subbasin network,
where nodes are located at SubBasin lat-long centroids, and
edge widths of the network correspond to contributing upstream area.
The plot is generated using the ggplot2 library, with dependencies on igraph for handling network information.
Examples
# read in rvh file
rvh <- rvn_rvh_read(system.file("extdata","Nith.rvh", package="RavenR"))

# create network plot of watershed structure from rvh file
rvn_rvh_subbasin_network_plot(rvh$SBtable)


# include labels
rvn_rvh_subbasin_network_plot(rvh$SBtable, labeled=TRUE)
# include labels
rvn_rvh_subbasin_network_plot(rvh$SBtable, labeled=TRUE)