rvn_custom_output_plot is used to plot the custom output from Raven
rvn_custom_output_plot(cust, IDs = NULL, prd = NULL)Arguments
- cust
custom output object from custom.read
- IDs
(optional) array of HRU IDs, subbasin IDs, HRU Group names/IDs to include in plots
- prd
(optional) period to use in plotting
Value
- TRUE
return
TRUEif the function is executed properly
Details
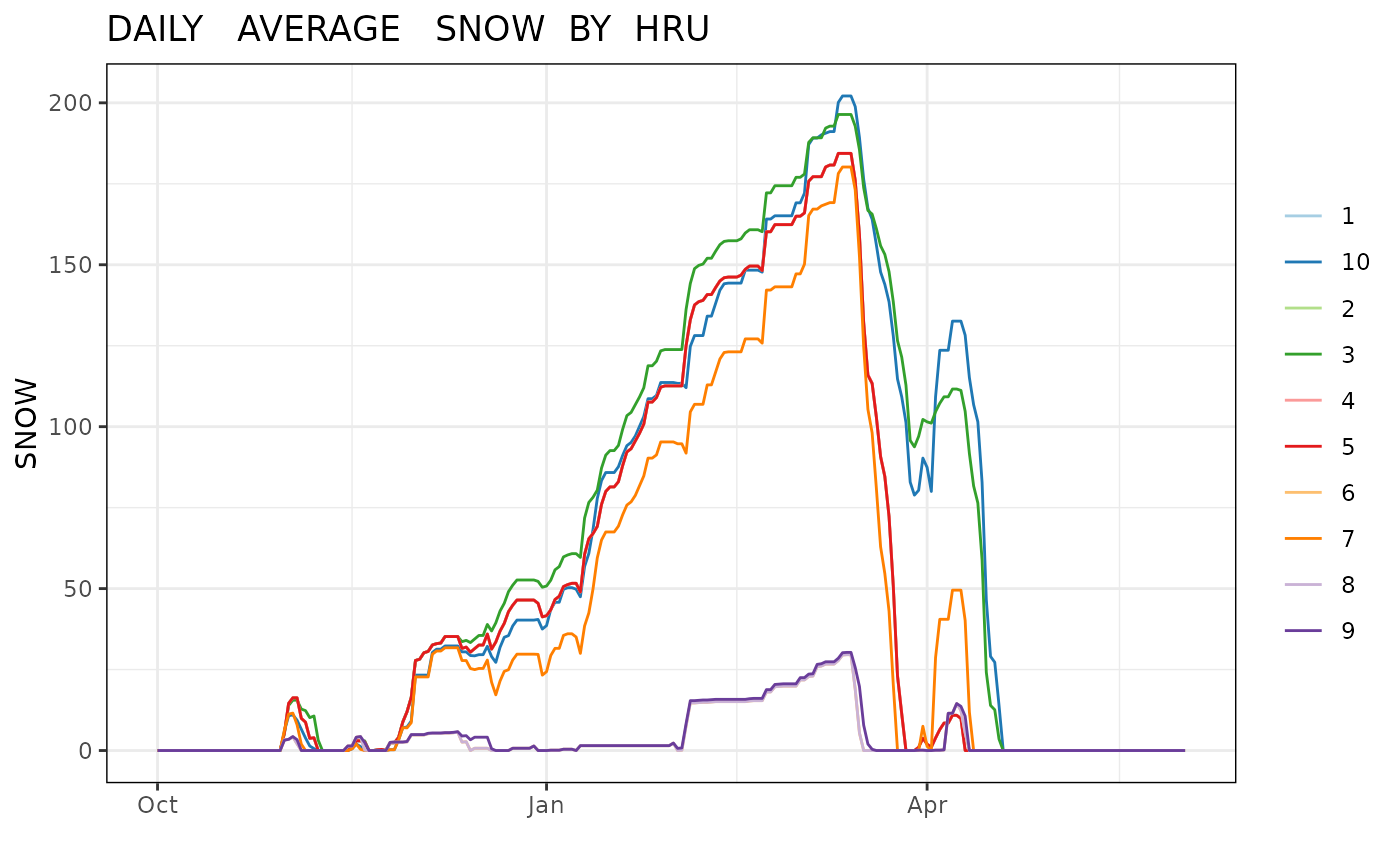
The custom output should be first read in using the rvn_custom_read function. Note that in this case the plot title is included, generated from the information in the filename. This plot title may be changed with ggplot2 commands.
See also
rvn_custom_output_plot for plotting custom output
Examples
# read in custom output from sample data
ff <- system.file("extdata/run1_SNOW_Daily_Average_ByHRU.csv", package="RavenR")
mycustomdata <- rvn_custom_read(ff)

# plot custom data (first 10 HRUs)
rvn_custom_output_plot(mycustomdata, IDs=seq(1,10), prd="2002-10-01/2003-06-01")