Generate runoff coefficients upstream of gauges
Source:R/rvn_calc_runoff_coeff.R
rvn_calc_runoff_coeff.RdUses the rvh, custom precipitation, and hydrograph information to determine runoff coefficients.
rvn_calc_runoff_coeff(
  rvhfile,
  custfile = "PRECIP_Daily_Average_BySubbasin.csv",
  hydfile = "Hydrographs.csv",
  correct = FALSE
)
Arguments
- rvhfile
file path to Raven rvh file
- custfile
file path to Raven-generated custom output precip-by-subbasin file
- hydfile
file path to Raven-generated hydrographs file
- correct
(optional) if
TRUE, tries to correct runoff coefficient for missing data (assumes missing~0 flow)
Value
data frame with runoff coefficients of gauged basins
Details
Reads model.rvh file and daily avg subbasin precip file (usually PRECIP_Daily_Average_BySubbasin.csv) and generates data frame describing runoff coefficients of gauged basins and observation data coverage. Uses precipitation from entire model run history. Only determines runoff coefficient from available data - prone to overestimation with poor observation coverage.
See also
rvn_rvh_read for reading and processing Raven rvh file
Examples
myrvh <- system.file("extdata","Nith.rvh", package="RavenR")
mycust <- system.file("extdata", "run1_PRECIP_Daily_Average_BySubbasin.csv", package="RavenR")
myhyd <- system.file("extdata", "run1_Hydrographs.csv", package="RavenR")
rcs <- rvn_calc_runoff_coeff(myrvh, mycust, myhyd, correct=TRUE)
rcs
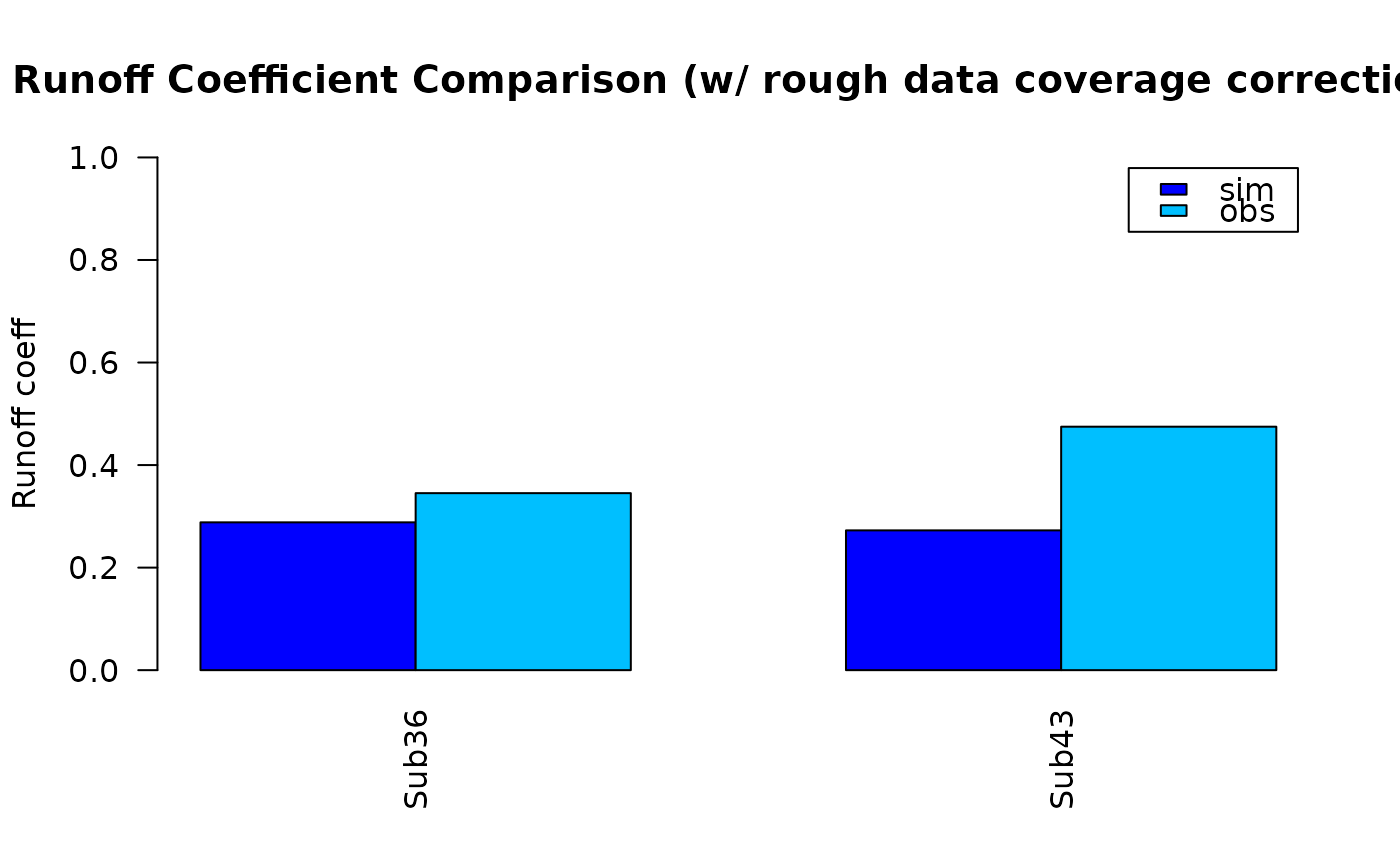
#> runoff_coeff_sim runoff_coeff_obs obs_cover
#> Sub36 0.2882955 0.3452300 0.998632
#> Sub43 0.2726318 0.4748434 0.998632
# create a bar plot
runcoefs <- subset(rcs,select=c(runoff_coeff_sim,runoff_coeff_obs))
bp <- barplot(t(as.matrix(runcoefs)),
main="Runoff Coefficient Comparison (w/ rough data coverage correction)",
ylab = "Runoff coeff", ylim=c(0,1),beside=TRUE,
col=c("blue","deepskyblue"),legend.text=c("sim","obs"),las=2)