Plot of Annual Median, Upper and Lower Quantiles of Flow
Source:R/rvn_annual_quantiles_plot.R
rvn_annual_quantiles_plot.RdCreates a plot of the annual flow quantiles provided by the rvn_annual_quantiles function.
rvn_annual_quantiles_plot(
  qdat,
  mediancolor = "black",
  ribboncolor = "grey60",
  ribbonalpha = 0.5,
  explot = NULL
)
Arguments
- qdat
Time series object generated by
rvn_annual_quantiles- mediancolor
Color for the median line
- ribboncolor
Color for the lower/upper quantile ribbon
- ribbonalpha
Transparency of lower/upper quantile ribbon
- explot
Existing ggplot object to which median line and quantile ribbon should be added
Value
p1 ggplot object of quantiles plot
Examples
system.file("extdata","run1_Hydrographs.csv", package="RavenR") %>%
rvn_hyd_read(.) %>%
rvn_hyd_extract(subs="Sub36",.) ->
hyd_data
# Calculate quantiles for the simulated hydrograph
qdat <- rvn_annual_quantiles(hyd_data$sim)
head(qdat)
#> 10% 50% 90%
#> 2003-10-01 3.018155 4.327215 5.636275
#> 2003-10-02 3.590286 7.312070 11.033854
#> 2003-10-03 3.985922 9.075290 14.164658
#> 2003-10-04 3.716070 5.962030 8.207990
#> 2003-10-05 4.518400 4.583560 4.648720
#> 2003-10-06 4.303779 4.685735 5.067691
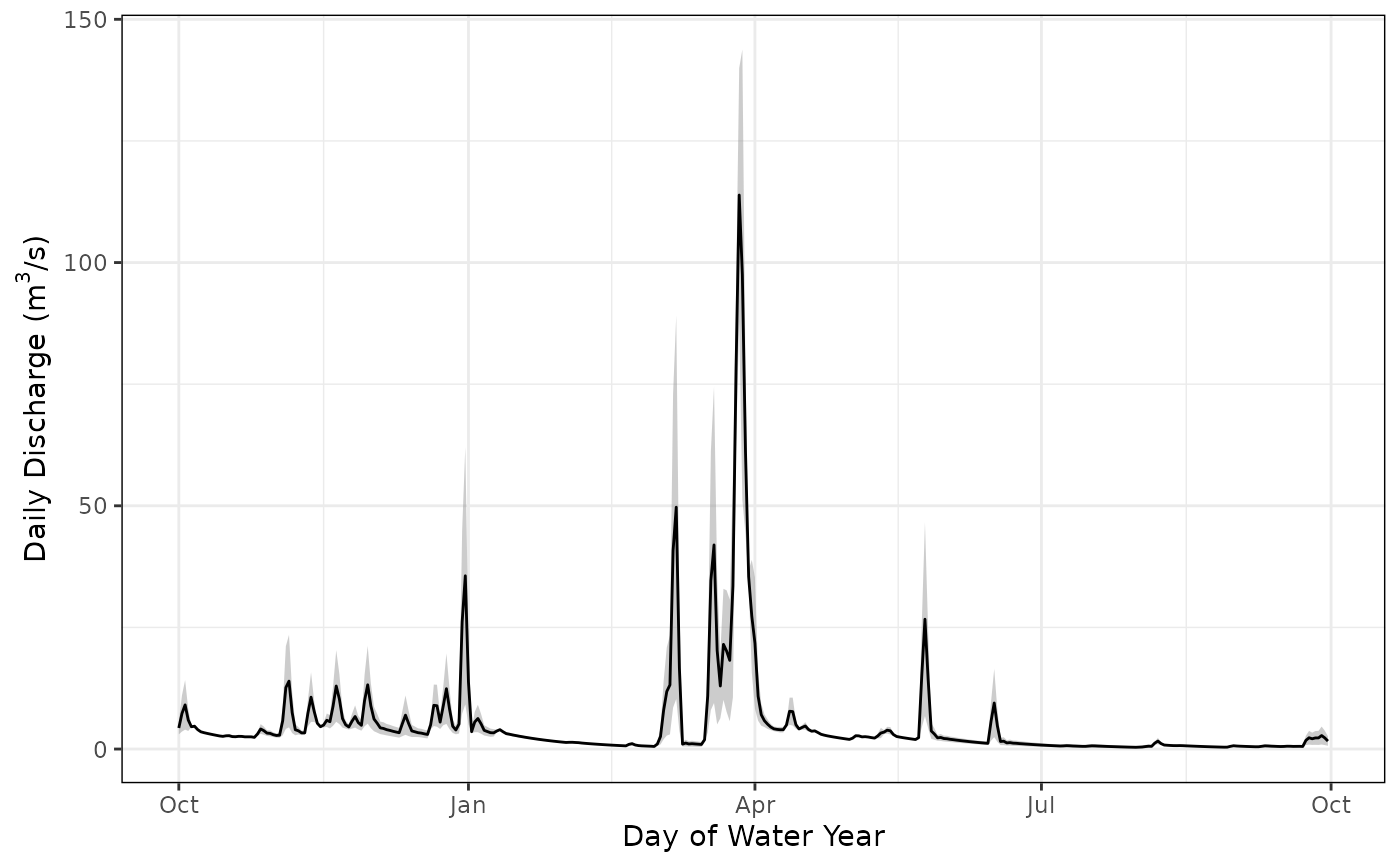
# Plot
p <- rvn_annual_quantiles_plot(qdat)
p # view plot
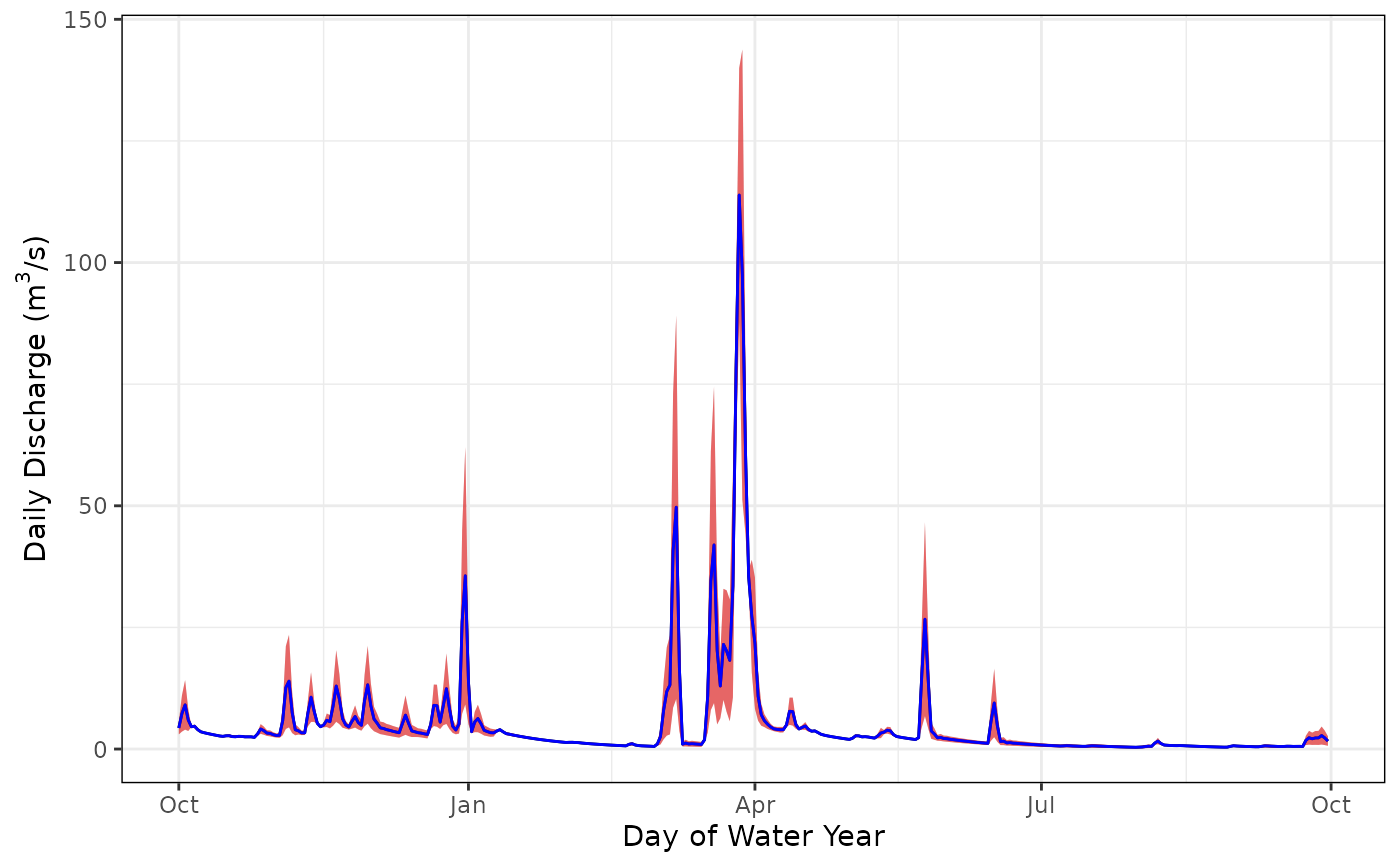
 # Add a second hydrograph to compare
qdat_sim <- rvn_annual_quantiles(hyd_data$sim)
p1 <- rvn_annual_quantiles_plot(qdat_sim, mediancolor = 'blue', ribboncolor = 'red', explot = p)
p1 # view plot
# Add a second hydrograph to compare
qdat_sim <- rvn_annual_quantiles(hyd_data$sim)
p1 <- rvn_annual_quantiles_plot(qdat_sim, mediancolor = 'blue', ribboncolor = 'red', explot = p)
p1 # view plot