rvn_annual_peak creates a plot of the annual observed and simulated peaks, based on the water year.
rvn_annual_peak(
  sim,
  obs,
  mm = 9,
  dd = 30,
  add_line = TRUE,
  add_r2 = FALSE,
  add_eqn = FALSE
)
Arguments
- sim
time series object of simulated flows
- obs
time series object of observed flows
- mm
month of water year ending (default 9)
- dd
day of water year ending (default 30)
- add_line
optionally adds a 1:1 line to the plot for reference (default
TRUE)- add_r2
optionally computes the R2 and adds to plot (default
FALSE)- add_eqn
optionally adds the equation for a linear regression line through the origin (default
FALSE)
Value
returns a list with peak data in a data frame, and a ggplot object
- df_peak
data frame of the calculated peaks
- p1
ggplot object with plotted annual peaks
Details
Creates a scatterplot of the annual observed and simulated peaks, calculated for each available water year of data within the two series provided. The default start of the water year is October 1st, but may be adjusted through function parameters. Note that the calculation uses the peak magnitude of simulated and observed series in each water year, without considering the timing of the events in each series.
The sim and obs should be of time series (xts) format and are assumed to be of the same length and time period. The flow series are assumed to be daily flows with units of m3/s.
The R2 diagnostic is calculated for a fit with no intercept, consistent with the provided 1:1 line (in a perfect fit the points are identical, and intercept is automatically zero).
Note that a plot title is purposely omitted in order to allow the automatic generation of plot titles.
See also
rvn_annual_volume to create a scatterplot of annual flow
volumes rvn_annual_peak_event to consider the timing of peak
events.
Examples
# load sample hydrograph data, two years worth of sim/obs
data(rvn_hydrograph_data)
sim <- rvn_hydrograph_data$hyd$Sub36
obs <- rvn_hydrograph_data$hyd$Sub36_obs
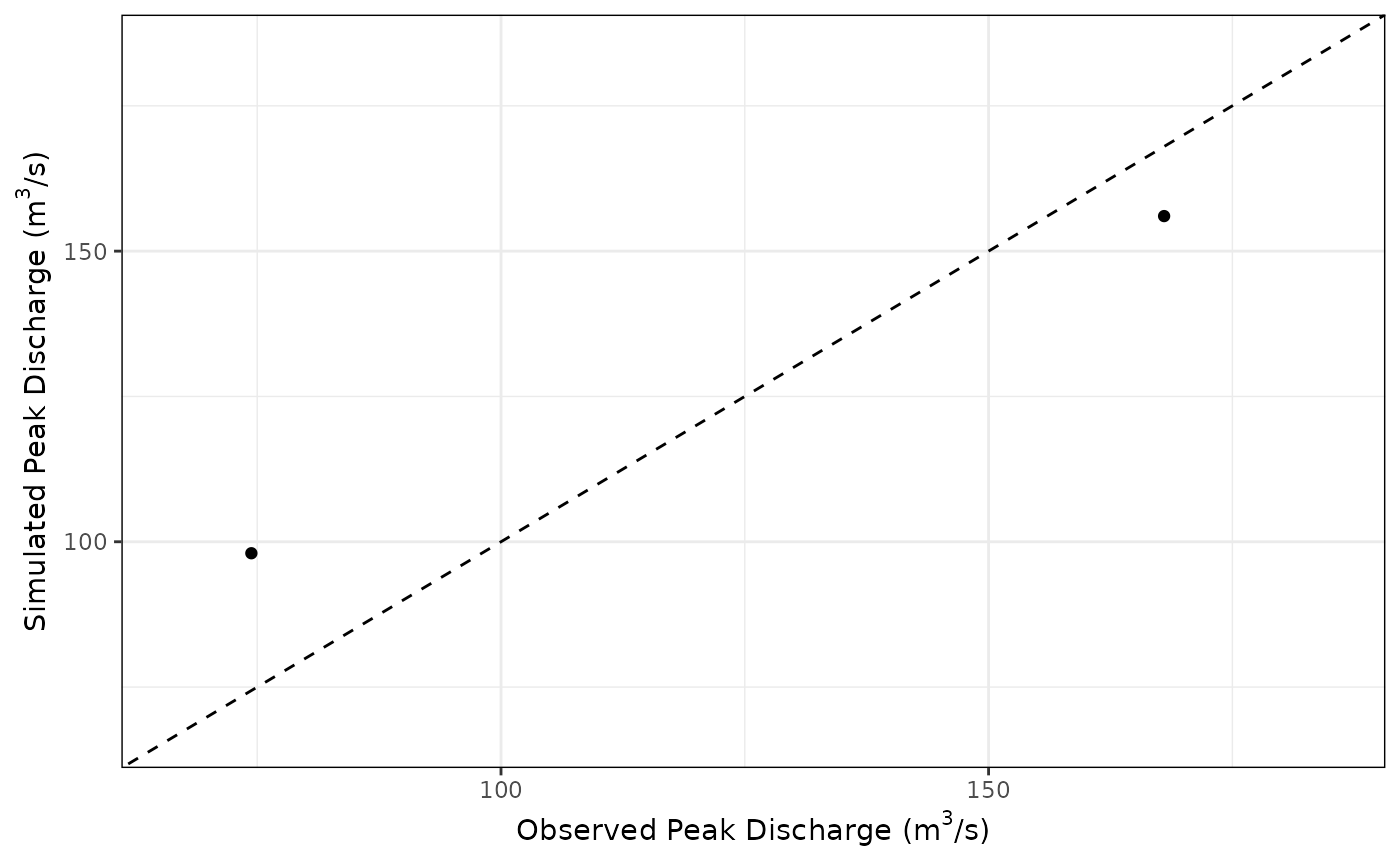
# create a plot of annual peaks with default options
peak1 <- rvn_annual_peak(sim, obs)
peak1$df_peak
#> date.end sim.peak obs.peak
#> 1 2003-09-30 98.0247 74.4
#> 2 2004-09-30 156.0300 168.0
peak1$p1
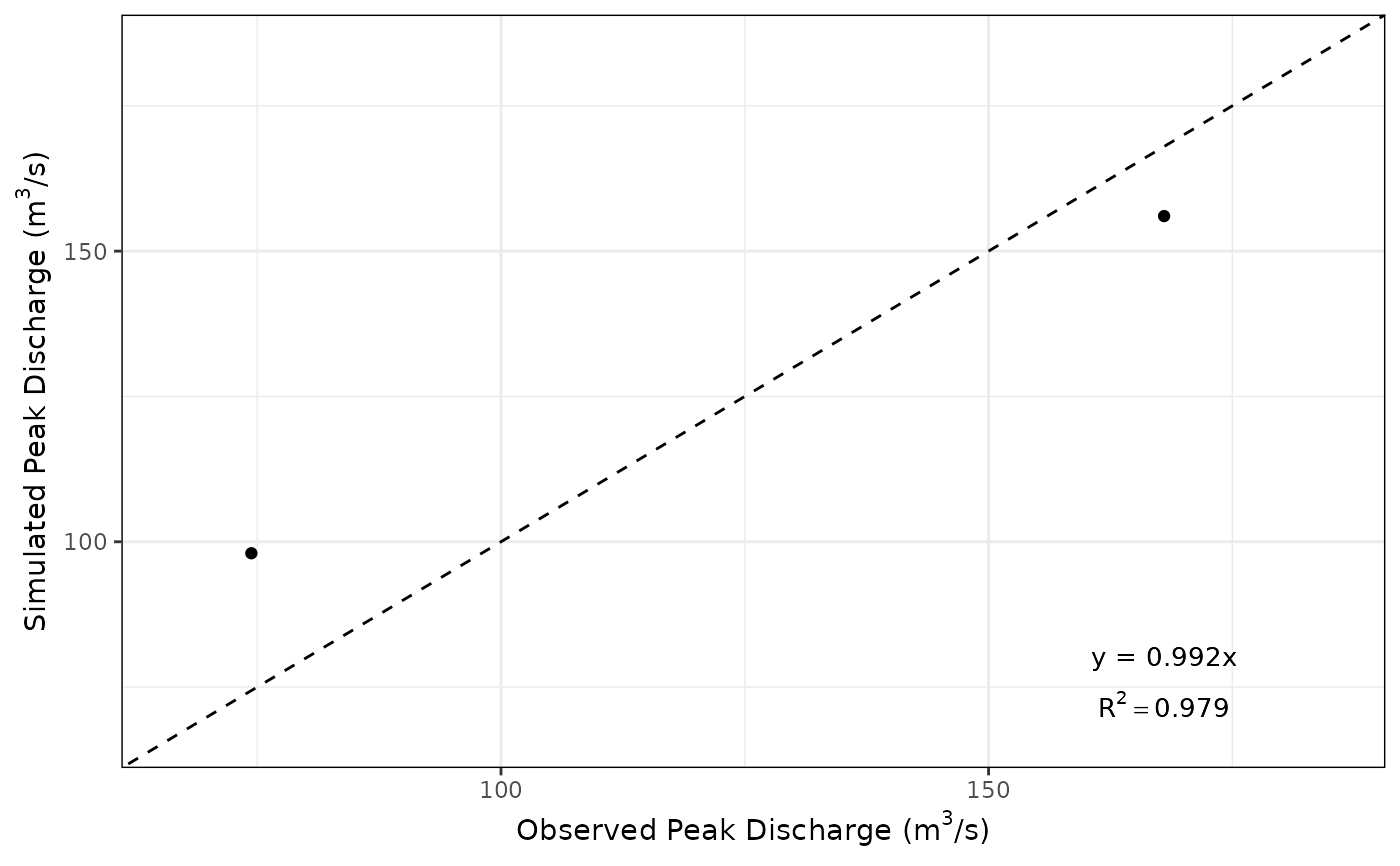
 # plot with r2 and regression equation
peak_df <- rvn_annual_peak(sim, obs, add_r2=TRUE, add_eqn=TRUE)
peak_df$p1
# plot with r2 and regression equation
peak_df <- rvn_annual_peak(sim, obs, add_r2=TRUE, add_eqn=TRUE)
peak_df$p1